Our powerful purpose-built software delivers engineering and investment-grade analysis that accounts for property location, design & construction materials.
Climate Valuation’s risk analysis is powered by purpose-built software developed by Climate Risk Pty Ltd. These “Climate Risk Engines” integrate the user’s inputs with information from national and international climate data sets to provide quantitative analysis of how climate change-related hazards may affect the current and future risk to the property selected.
Results are summarised in an overall Climate Resilience Rating which may be used as an indication of the future insurability and value degradation of the representative property over three key points in time.
Results are summarized in an overall Climate Resilience Rating which may be used as an indication of the future insurability and value degradation of the representative property over three key points in time.
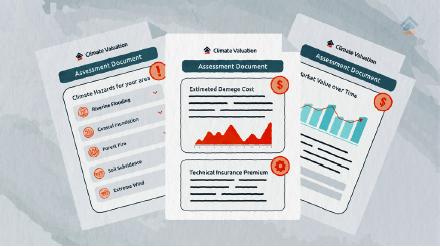
Technical Insurance Premium is equivalent to the Annual Average Cost of Damage to the representative property caused by extreme weather and climate change events.
Climate Adjusted Value represents the percentage reduction in value for the representative property, relative to an equivalent property unaffected by climate change.
An analysis of the individual contribution of each climate change and extreme weather hazard to the risk profile of the representative property over time.
Examines the impacts of extreme weather and climate change on individual elements of the representative property.
Individualized adaptation pathways such as maintenance, design upgrades or renovations may improve the resilience of the representative property.
Individualised adaptation pathways such as maintenance, design upgrades or renovations may improve the resilience of the representative property.
Click on each of the key takeouts to jump down the page and read more.

Initially the Climate Valuation system creates a synthetic representation of a property that is based on common industry design standards and customisation by the user. This “Representative Property” could be configured to represent a real property at the same location, or an entirely hypothetical property being planned in that location.
Initially the Climate Valuation system creates a synthetic representation of a property that is based on common industry design standards and customization by the user. This “Representative Property” could be configured to represent a real property at the same location, or an entirely hypothetical property being planned in that location.
If not specified, the “Representative Property” may contain assumptions about things such as building year, replacement value, construction materials, wind speed thresholds and floor height above ground.
Settings and assumptions used to define the “Representative Property” are contained in the ‘Analysis Settings’ section of each report. These settings are important as they affect how the model calculates the associated risk to the “Representative Property” analysed. Paid reports allow more advanced customisation of the design and material features of the property.
If not specified, the “Representative Property” may contain assumptions about things such as building year, replacement value, construction materials, wind speed thresholds and floor height above ground.
Settings and assumptions used to define the “Representative Property” are contained in the ‘Analysis Settings’ section of each report. These settings are important as they affect how the model calculates the associated risk to the “Representative Property” analyzed. Paid reports allow more advanced customization of the design and material features of the property.

Climate Valuation analysis is powered by the custom-built and award-winning “Climate Risk Engines”. These engines draw on hundreds of hydrology, geology and satellite data sources to pull contextual information about an individual address:
Each data point is highly localised which means the Climate Valuation system can tell the difference between the side of a street that gets flooded when a river overflows and the side that does not.
Data points on the property’s location, surrounding environment and design are then coupled with long term data from local meteorological stations to provide a baseline level of exposure at that property’s exact location.

The system stress tests each component element of the ‘Representative Property’ against the extreme weather conditions to which it will likely be exposed, to determine the probability of failure or damage in each given year. This robust engineering-grade analysis accounts for a number of design and construction variables that impact a property’s vulnerability to damage from climate change and extreme weather.
For example:
For example:

Finally, risk and damage projections are adjusted to account for the modelled changes in frequency and intensity of each climate change related event (flooding, fire, drought), based on interpretations of global and regional climate models.
Future probabilities of damage are calculated by extracting changes in statistical distribution of key parameters such as heat, wind, humidity and precipitation to show the changing vulnerability of a property under a range of possible future emission scenarios and warming outcomes.
Climate Valuation reports range in price depending on the level of customisation and result details you require. Reports are available online and take 3-5 minutes to generate depending on your device.
Results include a simple ABC rating summarising the property’s ‘climate resilience’, an analysis of the key driving hazards contributing to the property’s extreme weather risk, and forward-looking projections on the impact of climate change on Insurance and Market value of the property over time.
Climate Valuation reports range in price depending on the level of customization and result details you require. Reports are available online and take 3-5 minutes to generate depending on your device.
Results include a simple ABC rating summarizing the property’s ‘climate resilience’, an analysis of the key driving hazards contributing to the property’s extreme weather risk, and forward-looking projections on the impact of climate change on Insurance and Market value of the property over time.
Find out the risks to your property with a FREE site check
< Insert search bar >
Website developed by The Marketing GP